Return to Home Page
Project 01
2024
Data Visualization
Compare & Contrast
Visual Design
Document Review

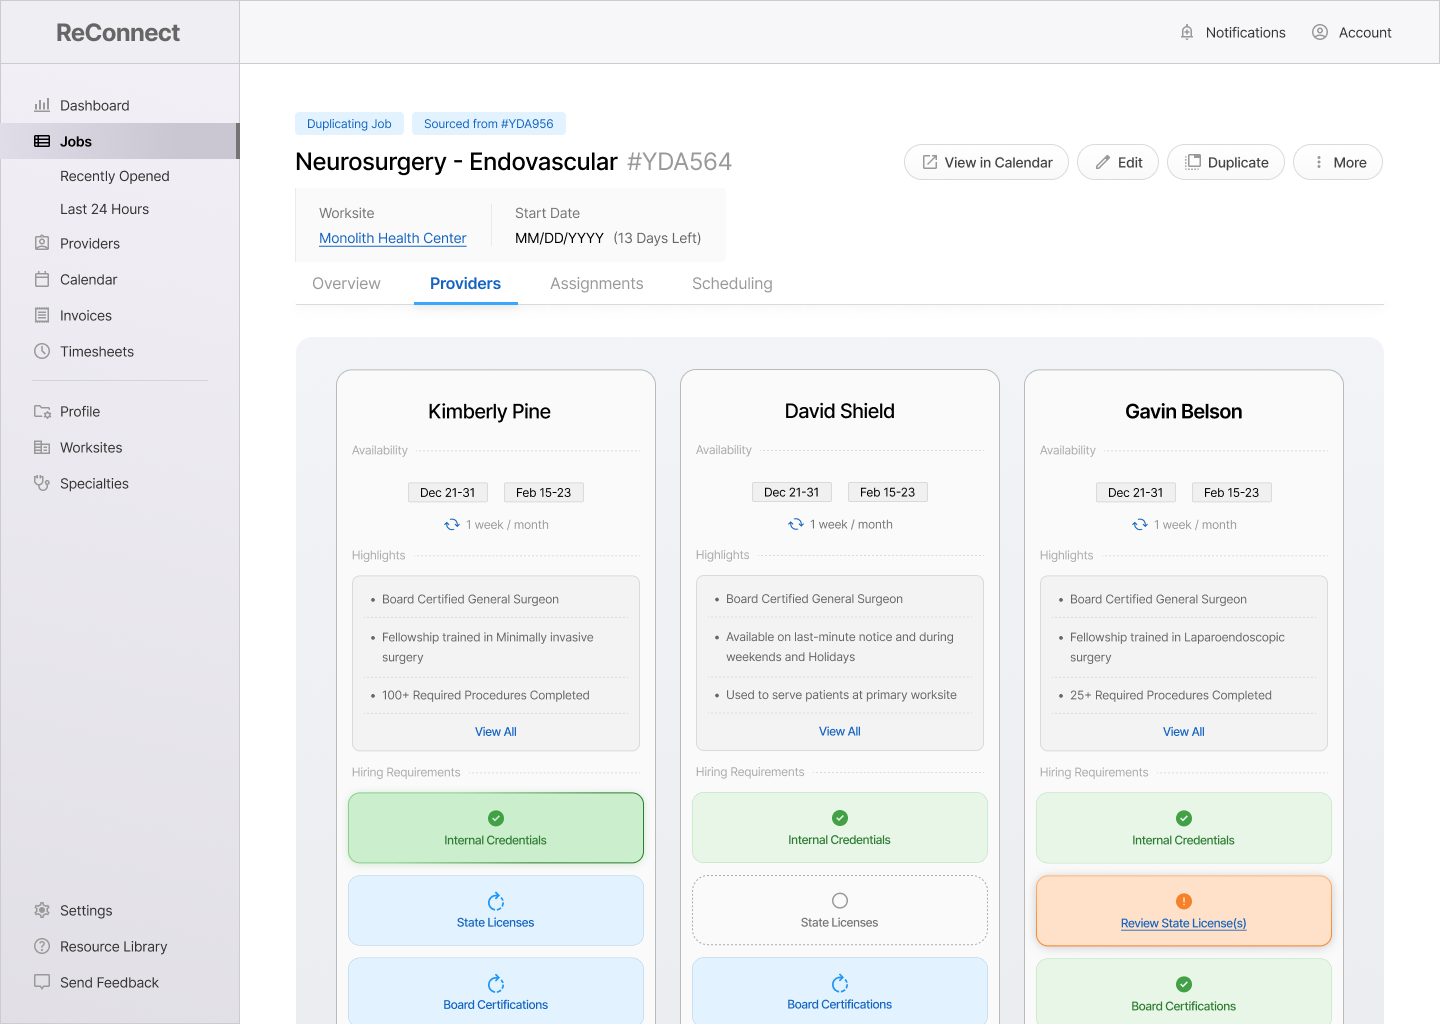
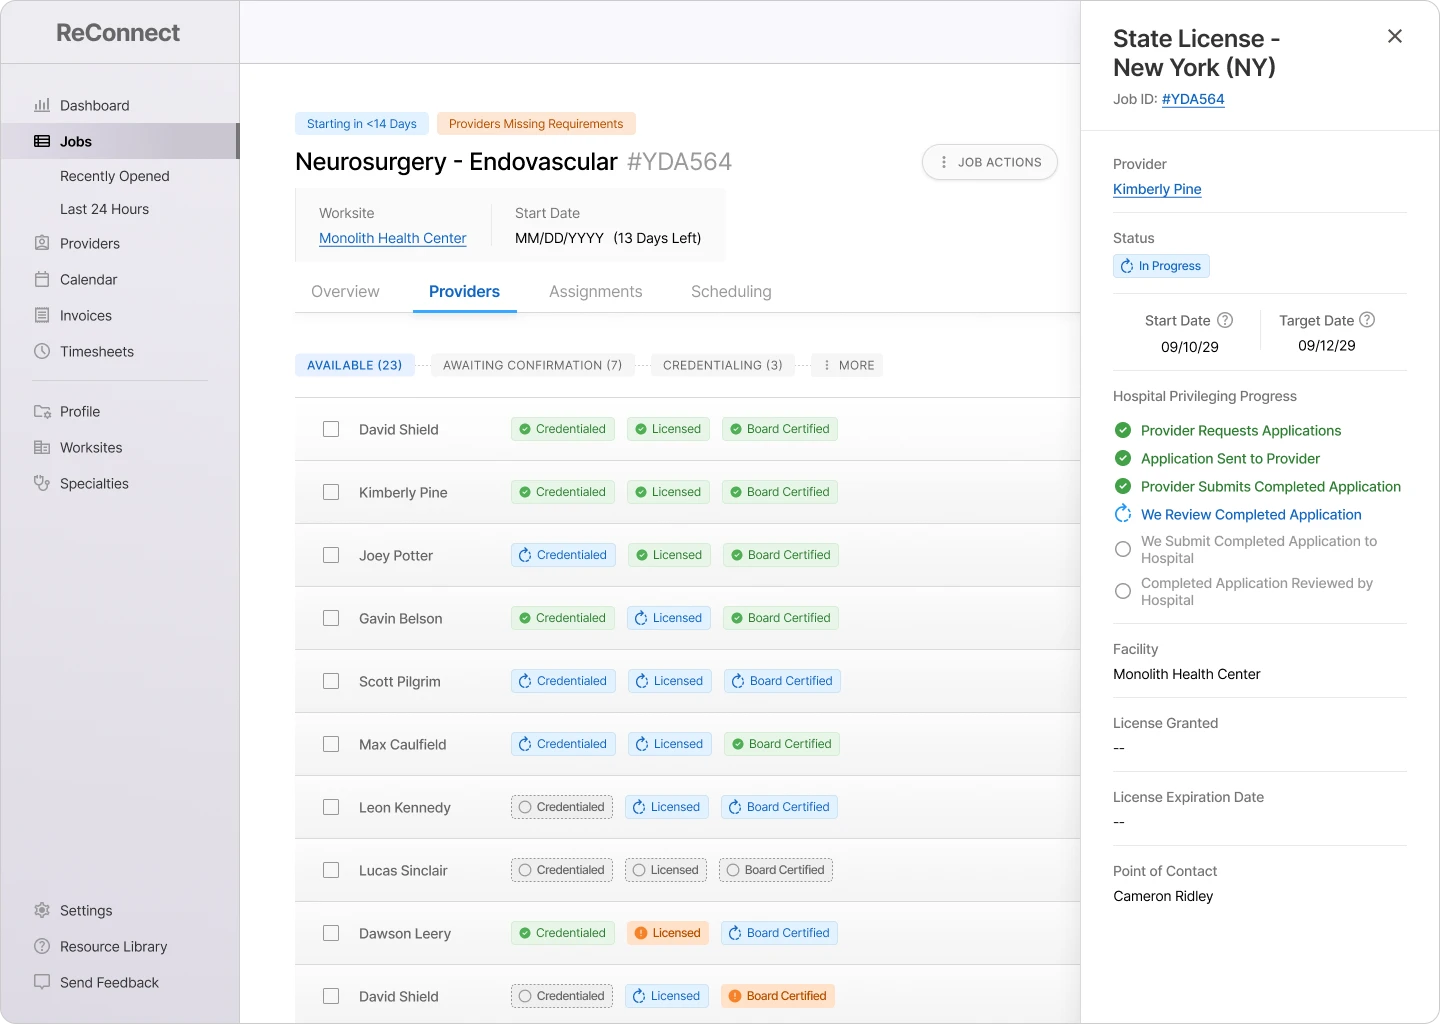
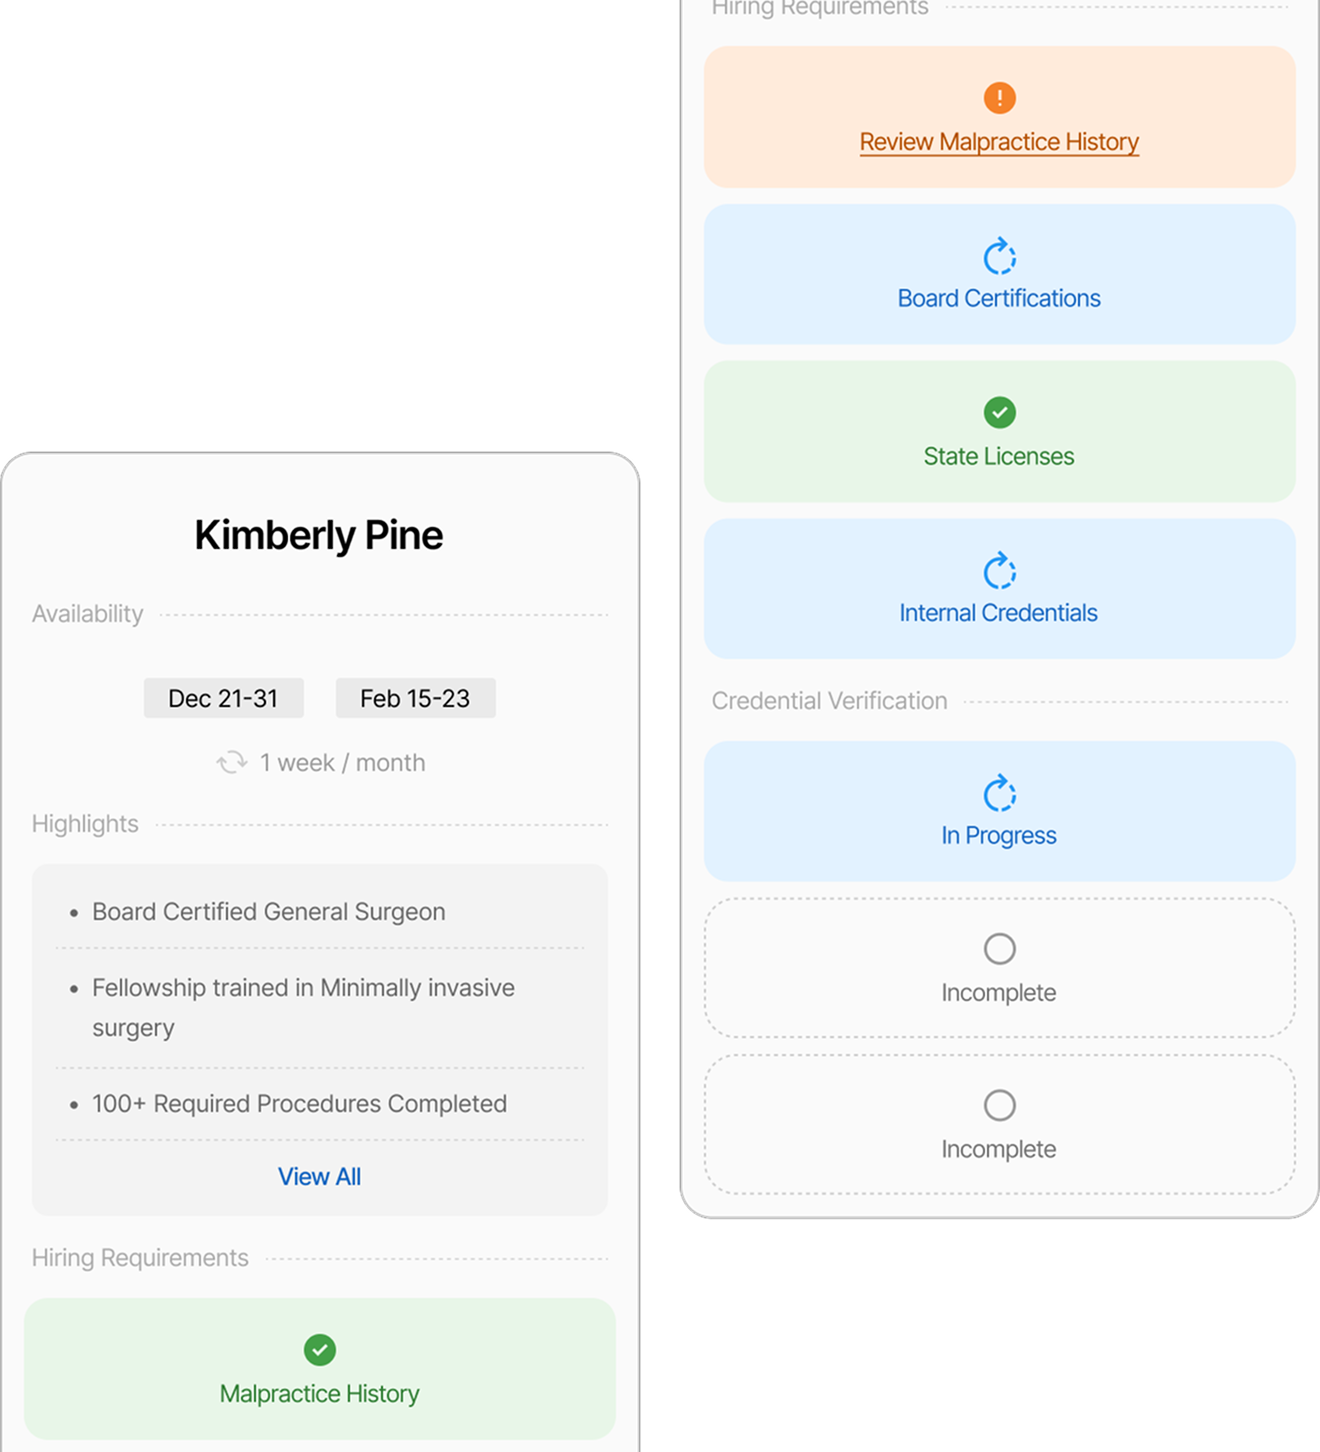
Visualizing Medical Licenses for Faster Hiring Decisions

Project Overview
Reduced the time required to qualify healthcare providers by transforming static, text-heavy proposals into a visual, product-wide strategy for tracking progress on specialized hiring criteria.
Project Overview
Eliminated hiring review processes by implementing a product-wide strategy for visualizing progress on hiring criteria.
The Problem
Reviewing a single role with 20+ providers creates a massive bottleneck for hospital coordinators, often requiring 4 to 8 hours of focused attention. The sheer effort required to narrow down a candidate pool often consumed their entire day, forcing them to neglect other critical responsibilities.
Inconsistent Data Formats
Applicants submitted 3–6 page proposals with varying layouts and hierarchies. Coordinators had to manually hunt for high-priority information, forcing them to read every page in detail just to locate basic credentials.
High Cognitive Load
Evaluating a single provider required checking the status of 8+ hiring requirements across 50+ different license types and certifications. With 20–50 providers per job, a thorough review could take days.
Inability to Compare
Because proposals were isolated, text-heavy documents, users couldn't compare qualifications side-by-side. They were forced to review every provider in a linear, detailed fashion before they could even begin to narrow the field.
The Solutions
Standardized Provider Snapshots
We extracted the 8 most critical hiring requirements and compiled them into a consistent, one-click summary. By surfacing this data directly in the UI, users can now scan a candidate’s viability without ever opening the full proposal document.
Side-by-Side Comparison
I designed a badge system (using color, icons, and labels) to map the status of 50+ license types. This created a uniform visual language across the product, making dense data instantly scannable.
Visual Progress Tracking
Gave users the ability to generate interactive charts comparing up to 3 providers' schedules, credentials, and progress on hiring requirements.
Clear Status Logic
Badges follow a clear 3-step progression (Incomplete, In Progress, Complete) with distinct states for Exceptions and Red Flags. This gives users immediate visibility into a provider’s readiness—or potential blockers—at a glance.
95%
of Intake Form Automated
Small Clients (<10 Worksites)
67%
of Intake Form Automated
Small Clients (<10 Worksites)
25%
of Intake Form Automated
Small Clients (<10 Worksites)
Required Item
Malpractice History
Status
Review Proposal
Click to View Proposal
Required License #1
Georgia (GA) License
Progress
In Progress
Required License #2
Minnesota (MN) License
Progress
Complete
Click to View All Details
Summary Panels on Hover: A Peek Into Complex Data
Displayed a short summary of the document(s) associated with a specific hiring requirement, including the last update and next step (when available).
Displays up to 3 key data points per requirement, with comprehensive detail available upon clicking.
Provides critical updates without forcing the user to leave their view or open a new page
Board Certification -
ABPN
In Progress
Current Status:
Application Submitted
(Oct 28, 2030)
Next Step:
Facility Confirms Acceptance
State License
In Progress
Current Status:
Application Submitted
(Oct 28, 2030)
Next Step:
Facility Confirms Acceptance
Job Requirement Cards: Capturing the Essential Details
Designed to give the user a complete snapshot into the status of 4+ key job requirements without having to click for additional info.
Gave users visibility into progress updates for 20+ providers without leaving the job page.
Reduced Clicks by 50% and Page-Loads to 0
(Accessing Requirement Updates)
Provider Comparison Grids: Making Complex Data Visual & Interactive
Gives the user an interactive birds-eye view for evaluating providers, allowing the user to hover over and click through details rather than read provider proposals.
Eliminated the need to manually create provider presentations in Excel
A live demonstration of this feature in Beta helped secure a $1 Million Client Contract
The Impact
Big-picture victories that resulted from this project. These are broad themes that were targeted based on user interviews and past feedback.
Secured a $1 Million Client Contract After Demo
Workflow Demonstrated
Provider Comparison
Completely Automated
Provider Comparison Charts
Features Impacted
Provider Comparison
Evolved Data Entry Standards for 2,000+ Recruiters
Features Impacted
Opening a New Job
Introduced Product-Wide Data Visualization Initiative
Workflows Impacted
All Product Functions
95%
of Intake Form Automated
Small Clients (<10 Worksites)
67%
of Intake Form Automated
Small Clients (<10 Worksites)
25%
of Intake Form Automated
Small Clients (<10 Worksites)
The Impact
Hospital staffing coordinators were allowing multiple days to pass without submitting job requirements to recruiters.
Intake Forms
Completely Automated
Small-Scale Clients (<10 Worksites)
Ended Accidental
Data Loss
Small-Scale Clients (<10 Worksites)
Integrated Three Core User Journeys into Design System
Small-Scale Clients (<10 Worksites)
95%
of Intake Form Automated
Small Clients (<10 Worksites)
67%
of Intake Form Automated
Small Clients (<10 Worksites)
25%
of Intake Form Automated
Small Clients (<10 Worksites)
The Outcomes
Hospital staffing coordinators were allowing multiple days to pass without submitting job requirements to recruiters.
95%
of Intake Form Automated
Small Clients (<10 Worksites)
67%
of Intake Form Automated
Small Clients (<10 Worksites)
25%
of Intake Form Automated
Small Clients (<10 Worksites)
95%
Small-Scale Clients (<10 Worksites)
67%
Small-Scale Clients (<10 Worksites)
33%
Small-Scale Clients (<10 Worksites)
The Numbers
95%
Clicks + Page-Loads
When Comparing Providers
65%
Review Time
Per Provider
50%
Review Time
Per Job
95%
of Intake Form Automated
Small Clients (<10 Worksites)
67%
of Intake Form Automated
Small Clients (<10 Worksites)
25%
of Intake Form Automated
Small Clients (<10 Worksites)